Strong organizations
run on a clear plan
Where you're headed. Where you are now.
Teams that see both take the fastest route to success.
Colorkrew WorkSaaS® Series
Trusted by over 1,200 companies!


Sound familiar?
No visibility into what each team is working on — the big picture is a blind spot
No visibility

Company goals and day-to-day work live in separate worlds, and teams never feel aligned
Misaligned goals

Your OKR tool is so complex that updates become a checkbox exercise nobody takes seriously
Tool fatigue

Colorkrew Goals solves all of this.
VISUAL / Visualization
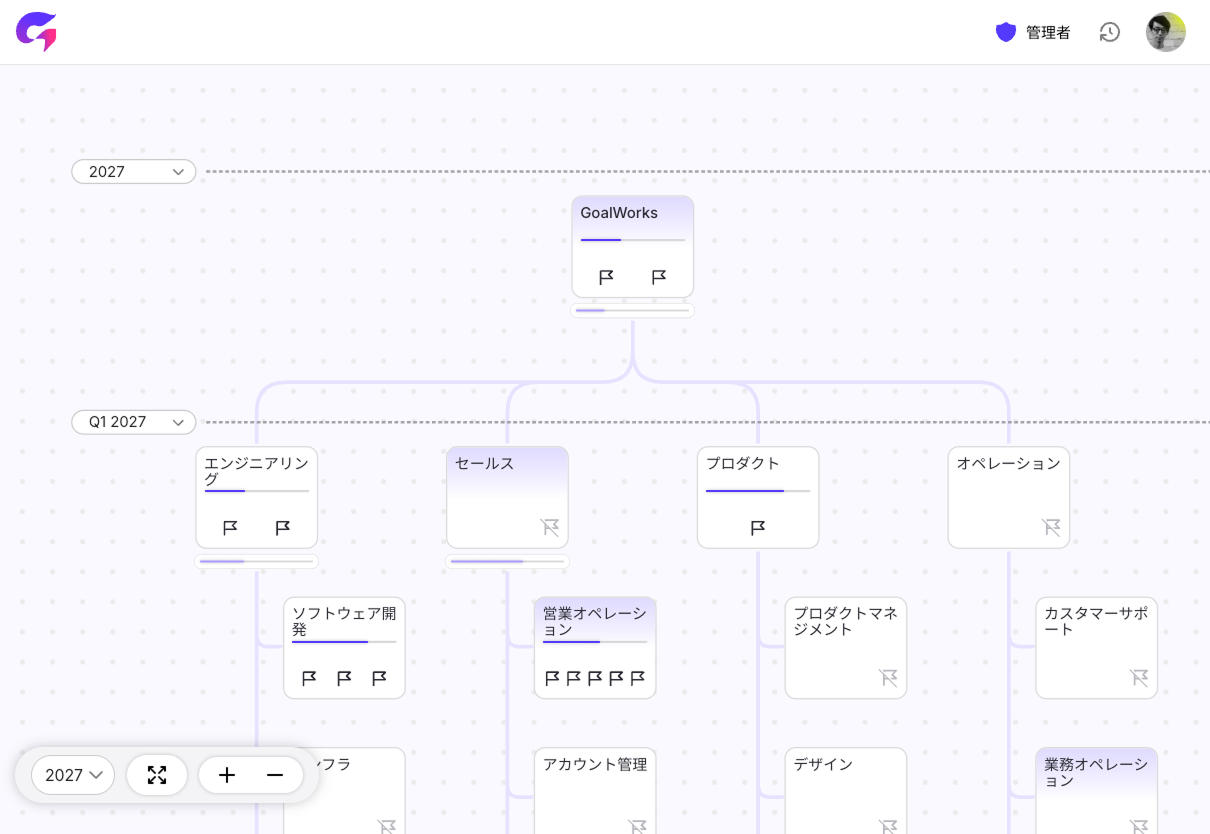
See your entire organization on a single, intuitive map
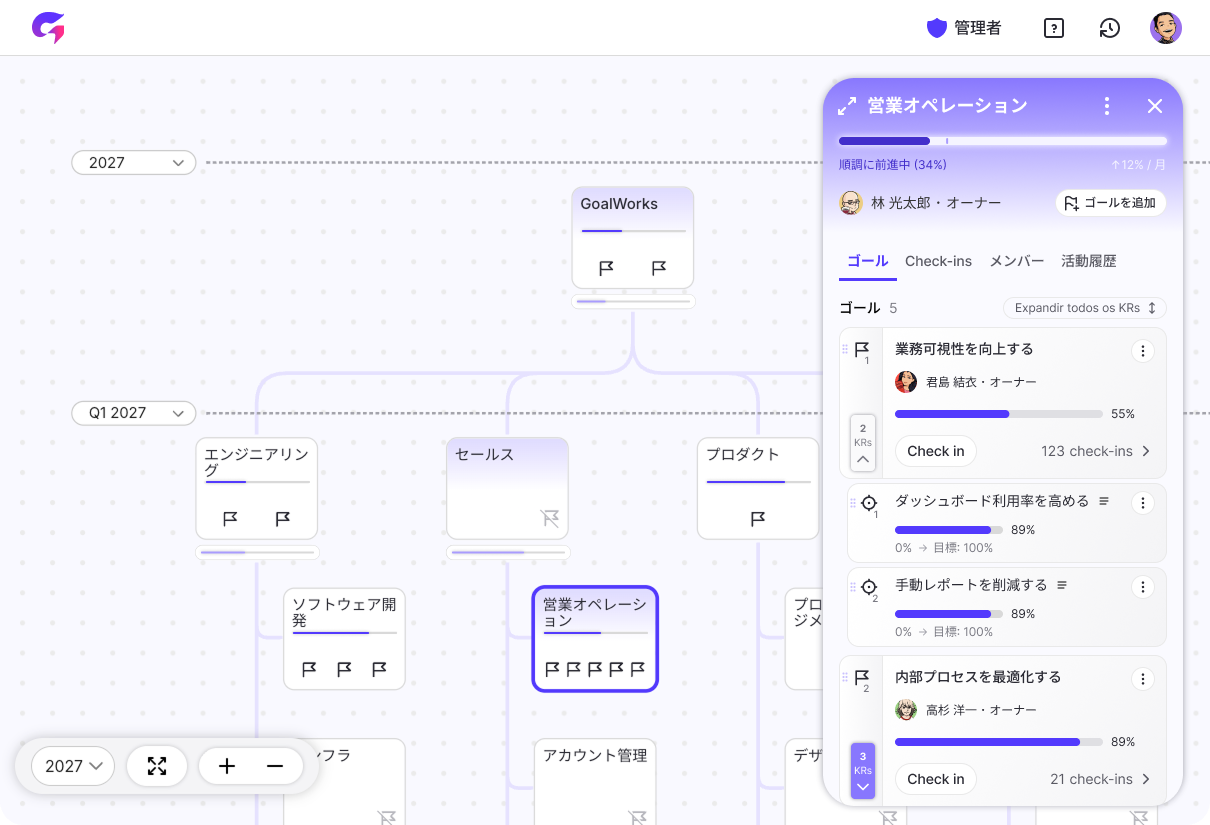
Departmental silos and opaque strategies are the biggest drags on organizational speed. Colorkrew Goals brings every goal and its progress together on one visual map. Instantly see what each team is working toward and how they're tracking. Break down information barriers, align everyone's focus, and make sharper decisions with real cross-functional visibility.
CONTEXT / Context sharing
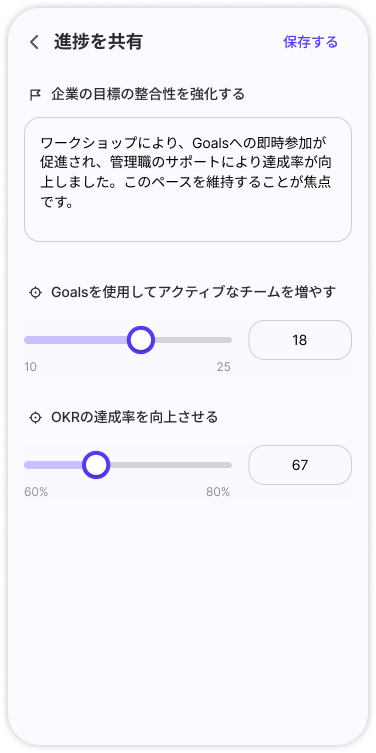
Check-ins that tell the real story — your map stays current, always
Update a Key Result value, drop a comment, and you're done. It's not just numbers — you share the why behind the progress. Goal completion is auto-calculated from KR averages, so the map always reflects where things actually stand, in real time, with zero manual rollups.
USABILITY / Building habits
So simple it sticks. No training, no friction, no excuses
No complex menus. No buried settings. Click the map, see the details — that's it. Anyone can pick it up in seconds, keeping the daily overhead of updates and reviews near zero. This frictionless experience is what turns goal-tracking from a chore into a habit, making reflection a natural part of how your organization operates.
What you can do with Colorkrew Goals
Flexible features designed to fit any workflow
Core features
Goal & progress tracking
- Set goals & Key Results by department
- Check-in (progress updates with comments)
- Auto-calculated goal progress
- Custom goal periods
Status visualization & history
- Goal map by department
- Timeline (activity history)
Organization & admin
- Department structure import (via our department app)
- Add/edit departments & invite members
- Freeze (lock goal editing & updates)
Extend Colorkrew Goals with Work SaaS add-ons
Workflows
Business operations
Scheduling & facilities
HR & org info
Hybrid work
Internal communication
- Quiz
- Updates (1-on-1)
See Colorkrew Goals in action.
From consultation to trial setup, our specialists have you covered.
Request a free demoWorld-class support
Three simple steps — start using it the same day you sign up.
1. Guided onboarding
We handle initial setup and walk your team through the basics so rollout is seamless. A dedicated specialist guides the entire process — no IT expertise required.
2. Ongoing customer support
Fast, reliable help whenever you need it.
Plus self-serve how-to guides and a comprehensive FAQ.
3. AI-powered assistance
An AI chatbot helps your team find internal information and answers on the spot.
It handles vague questions, supports multiple languages, and works for everyone — regardless of technical skill.

Get started in minutes
Three simple steps — start using it the same day you sign up.
Step 1
Sign up for a free trial

Step 2
Receive your account details

Step 3
Onboard and go live

Frequently asked questions
Common questions we hear before teams get started.
Q. What sets Colorkrew Goals apart from other OKR tools or spreadsheet-based management?
The biggest difference is the ability to see the health of your entire organization at a glance through a department-level map.
With spreadsheets or traditional list-based tools, each team's status is buried in separate tabs or nested views, making it extremely time-consuming to get the full picture.
Colorkrew Goals lays out every department's goals on a single map built around your org chart, so you can instantly spot which teams are on track and which are falling behind. No complex aggregation — just open the map and the current state of your organization is right there. This combination of low management overhead and exceptional visibility is something no other tool delivers.
Q. Can I migrate data from spreadsheets or other tools we're currently using?
For your organizational structure, yes — we support bulk CSV import. Format your existing department data into our CSV template, and you can build your entire org chart in the system at once, without manually creating each node.
For goals and KRs, the current workflow involves entering them directly on each department's map rather than bulk import. The idea is to get your org structure set up fast, then progressively add well-defined goals — leading to a smoother, higher-quality rollout.
Q. We've been burned by complex tools that nobody ended up using. Will this just add more work for our teams?
We designed Colorkrew Goals so that teams feel they're sharing progress for their own benefit, not filling in fields for management oversight.
Most tool fatigue comes from too many required fields or data that goes nowhere. Colorkrew Goals focuses on one thing: conveying the organization's status with the least possible input.
Updates are done with a simple progress slider and a brief comment — even from your phone during a commute. And because your entries show up directly on the map and double as progress reports for team meetings, there's no duplicate reporting. Less busywork, more value from every update.
Q. How does Colorkrew Goals handle qualitative goals that are hard to quantify?
You break down qualitative outcomes into specific, verifiable Key Results. Each KR has a name and a detailed definition field where you can spell out milestones and acceptance criteria upfront — for example, what state corresponds to what percentage of progress.
When updating progress, you enter the numerical value based on that definition and leave a check-in comment documenting the evidence. This eliminates vague, gut-feel progress reporting and creates an objective view through three layers: a clear definition, a fact-based number, and a comment that adds context.
Q. We have a large number of departments. Can we really see everything at a glance?
Absolutely. Each department's progress bar is shown alongside a baseline marker indicating where it should be at that point in time. You don't need to read individual numbers — just scan for gaps between bars and baselines.
When a bar falls short of its baseline, it immediately stands out as a visual anomaly, so departments that need attention are instantly identifiable. Even with hundreds of teams on a single screen, you can pinpoint problem areas in seconds.